Why do I hate the leadership of OHIO?!?!?!
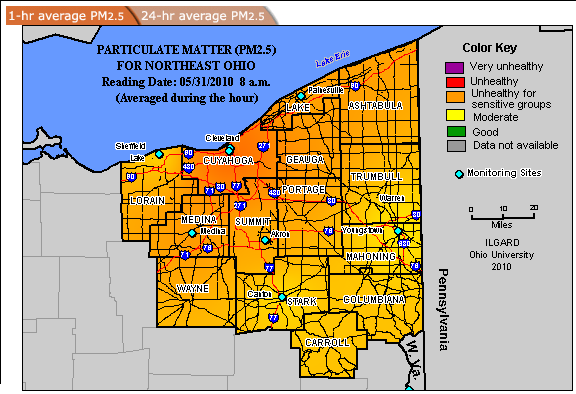
Why the hell was air quality in Cleveland and so Northeast Ohio, the region, the state and the world so "UNHEALTHY" last night, while we slept, and why is it so unhealthy RIGHT NOW - and HOW UNHEALTHY really, where, as indicated above?
Why are smart people with a choice "urban farming" in these conditions? Why did our PLANNERS PLAN it this way? Why aren't citizens warned about this, and why don't our leaders do something about this? Where is the social and environmental outrage and pursuit of justice in this community?!?!
This is not a one-time occurrence - our air around Northeast Ohio has been unhealthy by most standards every day for the past week, and is never nearly healthy enough. Have you even heard Mayor Jackson call for cleaner air in Northeast Ohio - ever seen him take any responsibility for the pollution here? How about ANY council-people...? Commissioners? CANDIDATES FOR ANY OFFICES IN OHIO, EVER????? They are killing their people, and are being killed... do they not care?
No, they do not care. They soak up huge industrial and union funding and political support and spew forth polluting rewards by gaming the environmental research, analysis and public awareness systems to hide pollution caused by their funders/supporters. As such, what environmental justice initiatives we do have for the region fail in their communications, analyses, planning and public service.... ultimately only to "benefit" powerful leaders of the coal, transportation, energy, construction, mining, metals and waste management industries, still profitting on old science that does not make economic sense and so is functionally dead! Basically, they are charity cases, supported by the people they kill.
Seems our leaders want citizens to go down with the ship... and they aren't bothering to provide deck chairs or a band.
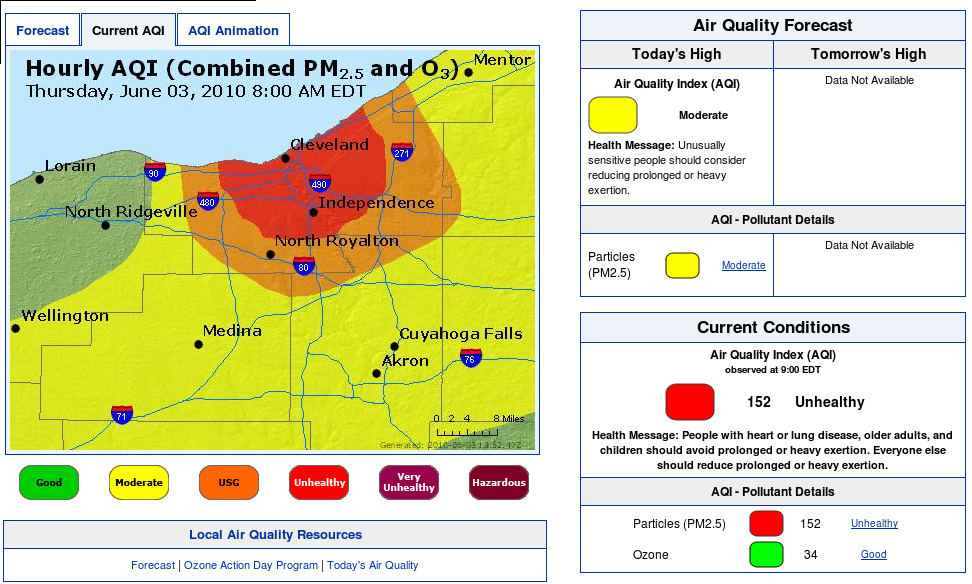
For example, at 10 AM today, June 3, 2010, I noticed I was having breathing problems and checked the various pollution advisory systems for the region.... and, a few clicks into Ohio EPA Partner AirNow's website [1] I saw the Ohio EPA reported UNHEALTHY conditions at 8 AM for all residents for much or Northeast Ohio - screenshot ABOVE.
Yet yesterday I had received an environmental advisory from the same Ohio EPA service forecasting the environmental conditions for today would be as follows:
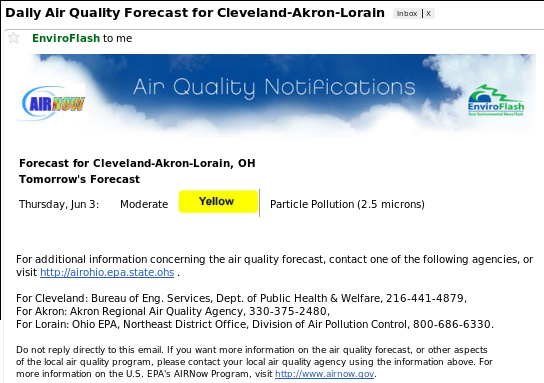
I thought they would be wrong - I follow all the environmental reporting available for the region that I know of and our air has been consistently unhealthy every day for the past week, with the only breaks being when the rain has washed the pollution into our drinking water and gardens, and on our children. Why are you only learning about this on realNEO? Because even on the Ohio EPA partner AirNow site they mislead the public, forecasting good conditions by email and still reporting that the forecast for our region is moderate, during an apparent health emergency...
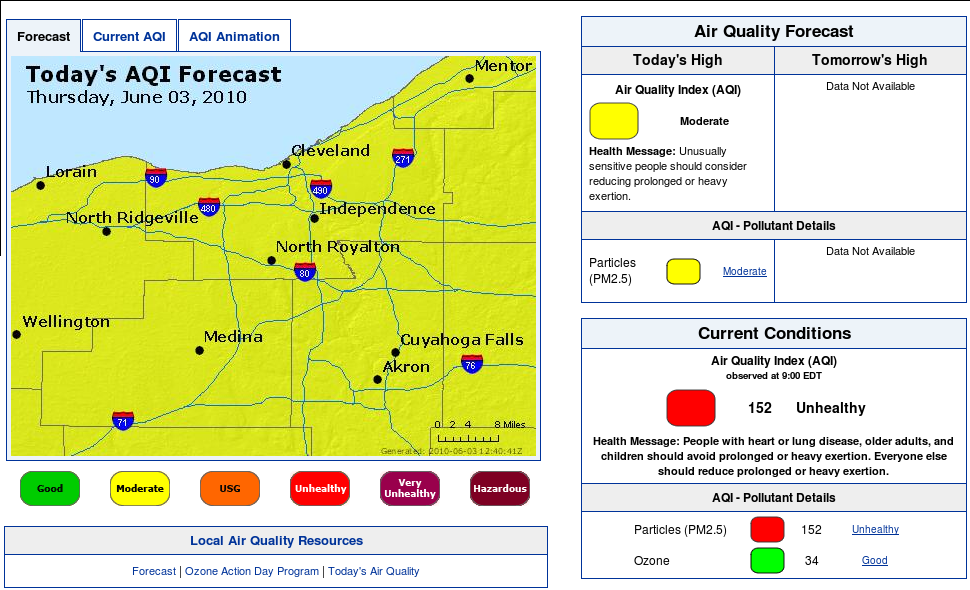
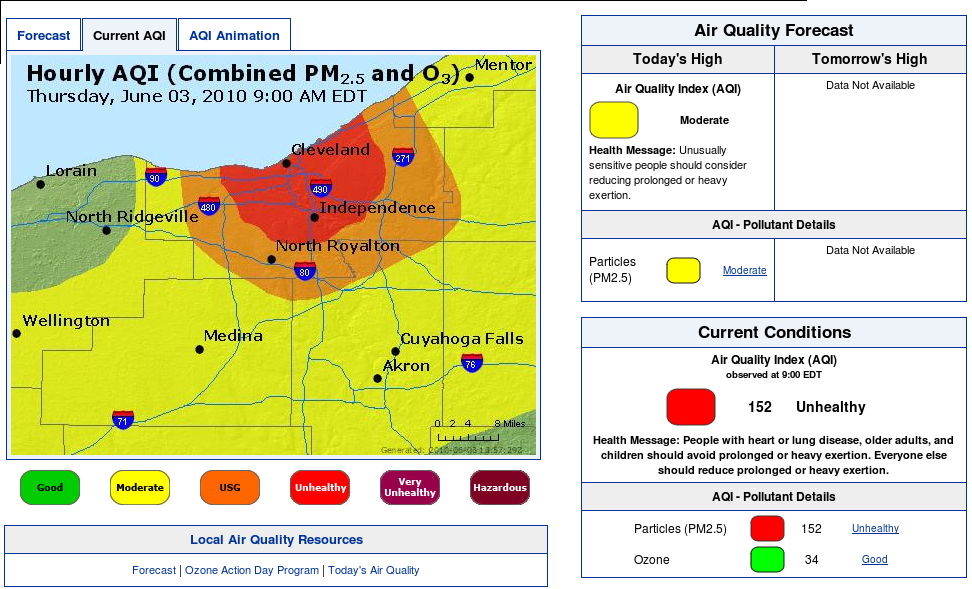
Yes, they are really "forcasting" a "high" of "moderate" as they are reporting "Current Conditions" two states worse - UNHEALTHY - at 152. The 9 AM air quality was measured as unhealthy (below)... yet the EPA air pollution site to the moderate forecast screen (above) and the forecast is not current with actuals, and no advisory was sent from the Ohio EPA, as is their subscription service... and no advisory from our local air quality reporting contractor, NOACA [2] - Northeast Ohio Area-wide Coordinating Agency.
Where is the reporting and outrage from the leaders and reporters in mainstream and alternative media over the environment crisis here, and over our poor citizen notification and preparedness capabilities - where is the discussion on Facebook, city.cleveland.oh.us and the blogs - at Green City Blue Lakes Institute and on their foundation-funded GCBL.ORG network - at their Sustainable Cleveland 2019 retreats and strategic planning - where is ELIMINATING AIR POLLUTION in the action plans, Re-imagining Cleveland, Kent Urban Design... CSU... Case?
Were is the outrage from our well paid career environmental stewards in local, statewide and national non-profits, universities and government?
Not at NOACA and the Cleveland EPA, it is clear. At the same time Ohio EPA is showing data indicating a health crisis, above, the NOACA pollution monitoring portal reports highly inconsistent data, and inconsistency in forecasting, reporting of actuals, and in apparent data acquisition, modeling and/or interpretation - everything about what seems to be going on behind the scenes at NOACA appears wrong...
Like today... NOACA appears wrong like this... while the Ohio EPA was reporting air quality conditions in our region as UNHEALTHY, above, NOACA... using the same monitoring equipment and data... presented our situation as such:
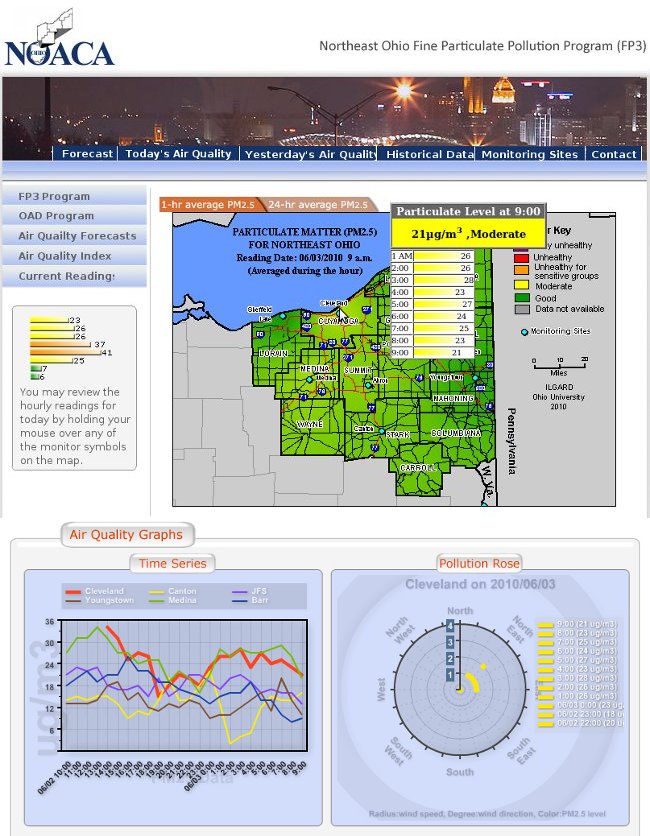
The pollution rose shows whatever pollution is being created in the Cleveland industrial valley is headed toward the Northeast, today... the East side and Eastern suburbs (where I live) should be especially concerned, if there is significant pollution. A hard look at the NOACA air pollution monitoring sight is reassuring - a very thorough look is far from reassuring, and nearly as disturbing as what is reported by the Ohio EPA above... one of the Cleveland monitoring stations reports unhealthy conditions!
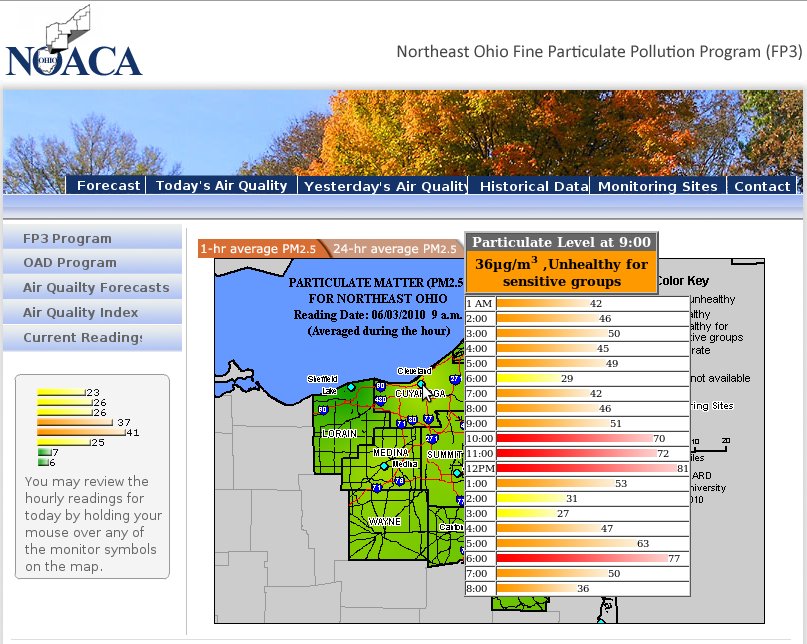
How unhealthy? Under such crisis conditions, it may be life-saving for 1,000s of area residents to stay on top of the air pollution hourly, and adjust their schedules accordingly... far more important than monitoring weather (gee, what do the TV stations spend a year on that?!?!)! Checking back on NOACA, an hour after the reading above, you will understand the meaning of "gaming the system"... below is public reporting of the same air pollution monitoring sites for the same region and monitoring equipment as above, and as airNow, now seen for 11AM:
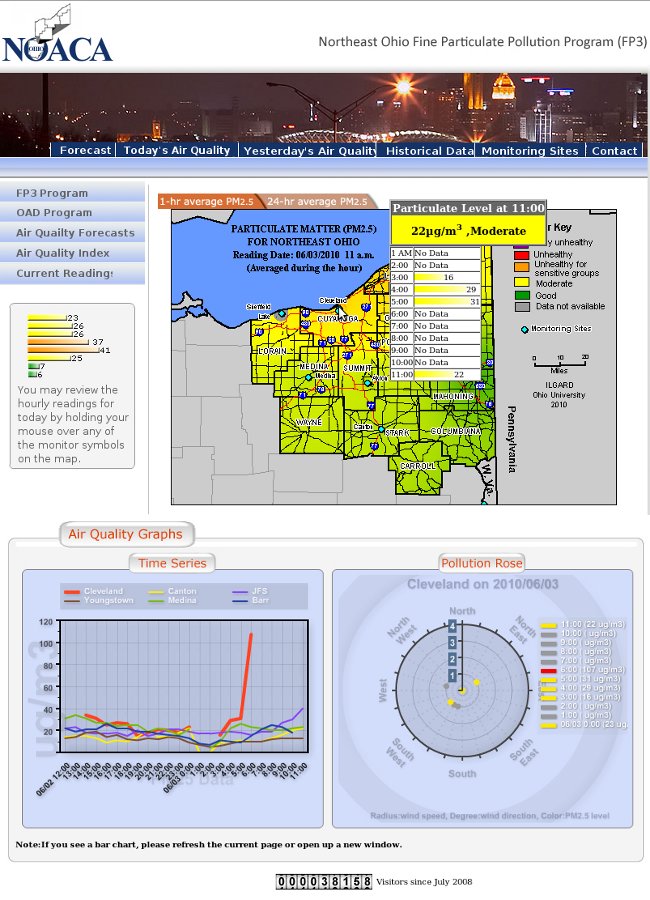
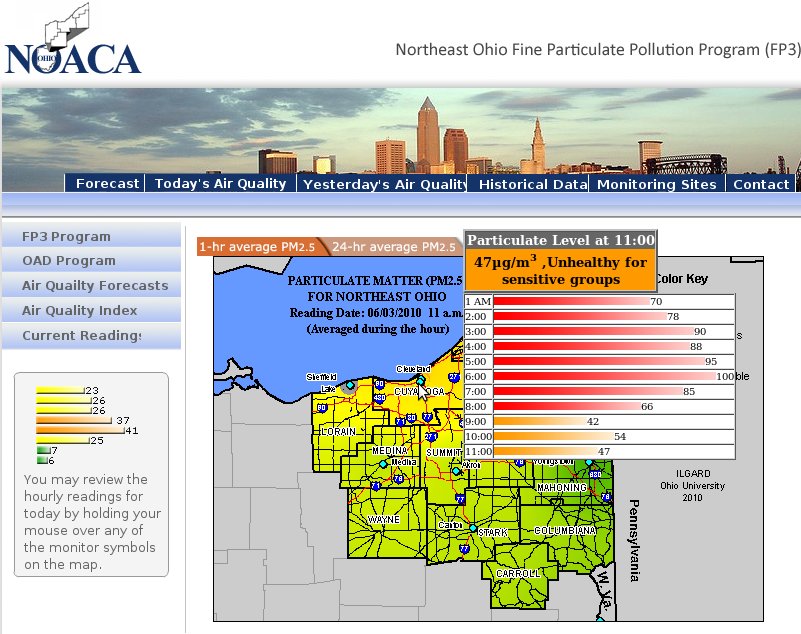
Suddenly nothing is clear about the air, our EPA monitoring or public health here - the NOACA data is now reporting "No Data" where it reported "moderate" before - there are gaps in the time series chart, and it does not track with the "no data" and other data reporting now or before - the rose chart has changed wind orientation and the data points make no sense at all - none of this data and reporting makes sense, it is not useful for citizens (it is harmful for citizens), and it does not track with AirNow reporting above, as partnered with the Ohio EPA. Digging deeper into today's current pollution picture at NOACA, the second monitor site screenshot above, with high pollution readings by NOACA before, also looks very different an hour later - what gives?
Air quality monitoring, notification and remediation in Northeast Ohio is poor if not criminal. We have far inadequate levels of monitoring and it is claimed some equipment in the region has a history of faulty operations. Currently, readings from some of the monitoring stations in Cleveland have shown extremely high, unhealthy readings and frequently the reading data seems to change in later air quality monitoring reports - different reporting systems report different results at different times - no results are real time and all seem subject to human intervention - all NOACA results seem to route through the coal burning Ohio University Voinovich School, which claims on it's website "The Voinovich School, through the Appalachian Watershed Research Group, the Consortium for Energy, Economics and the Environment (CE3), the Center for Air Quality, and the Environmental Studies program, has established itself as a leader in bringing people together to solve energy and environmental problems."
Ain't working, George! Back to school, OU.
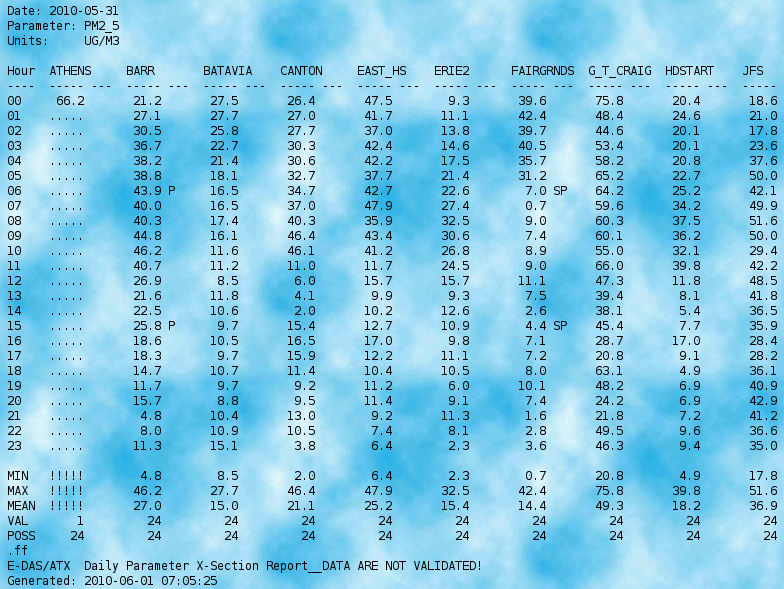
So far reported today, it appears, citizens of Northeast Ohio and surrounding regions (states, the world) have been exposed to levels of Particulate Matter PM2.5 over 152 ug per cubic meter - about 2.5X the 24 hour concentration of 65 ug per cubic meter, and 10X the Annual Arithmetic Mean of 15 ug per cubic meter, Primary and Secondary, which are acceptable by US EPA ambient air quality standards.
On Memorial Day, when there were few cars on the road, long before folks attempted their BBQ fires, the air was 2X worse than that - as bad as I've ever seen reported - as indicated below.... again, without any warning before or after the fact from the media, environmentalists, airNow or NOACA.... and with very inconsistent "real-time" and historical reporting, which I captured over the course of the day and following morning... what we learn about a real health crisis in NEO from NOACA, at the time of maximum pollution, discussed only on realNEO?!?!:
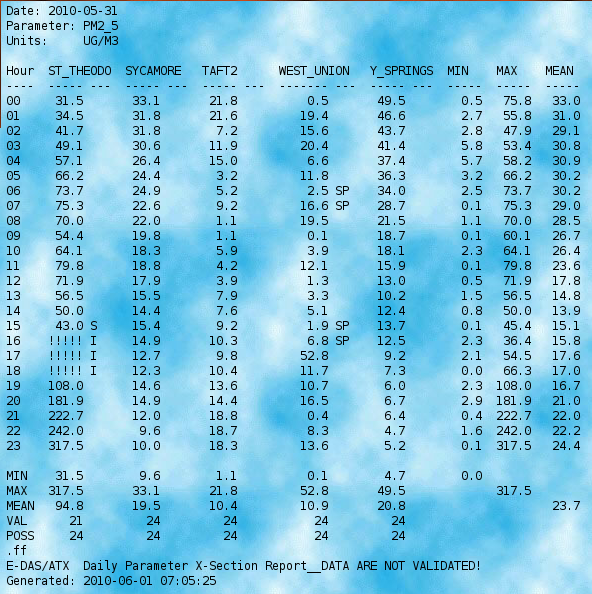
The air pollution felt far worse than what NOACA was reporting to me - the pollution shown above is fairly typical pollution for unreal NEO - so I dug past NOACA, past airNow (which also reported our air as moderately unhealthy) and found the source monitoring data reflected in all these charts above, and charted that for realNEO, and it is as frightening as imaginable, as below - those living near and downwind of the St. Theodus monitoring station were exposed to PM2.5 levels reading as high as 317.5 - nearly 6 times the ambient standard 24 hour concentration of 65 ug per cubic meter Primary and Secondary... more than 21X the annual mean standard... and who knows if that was even a peak measurement.
We only know what our leaders allow us to know about any of this, and to our leaders air pollution is obviously a big-money game where citizens are chosen losers.
Anyone for going to downtown Cleveland to lose your life-savings with your life, in the world's most polluted casino, soon coming to unrealNEO [3]!!!!!!!!!!!!!!!!!!
Thanks Action Jackson!
Ohio Air Quality Pollutant Monitoring Page
Yesterday's Highest One-Hour Pollutant Levels
(last updated on June 1, 2010)
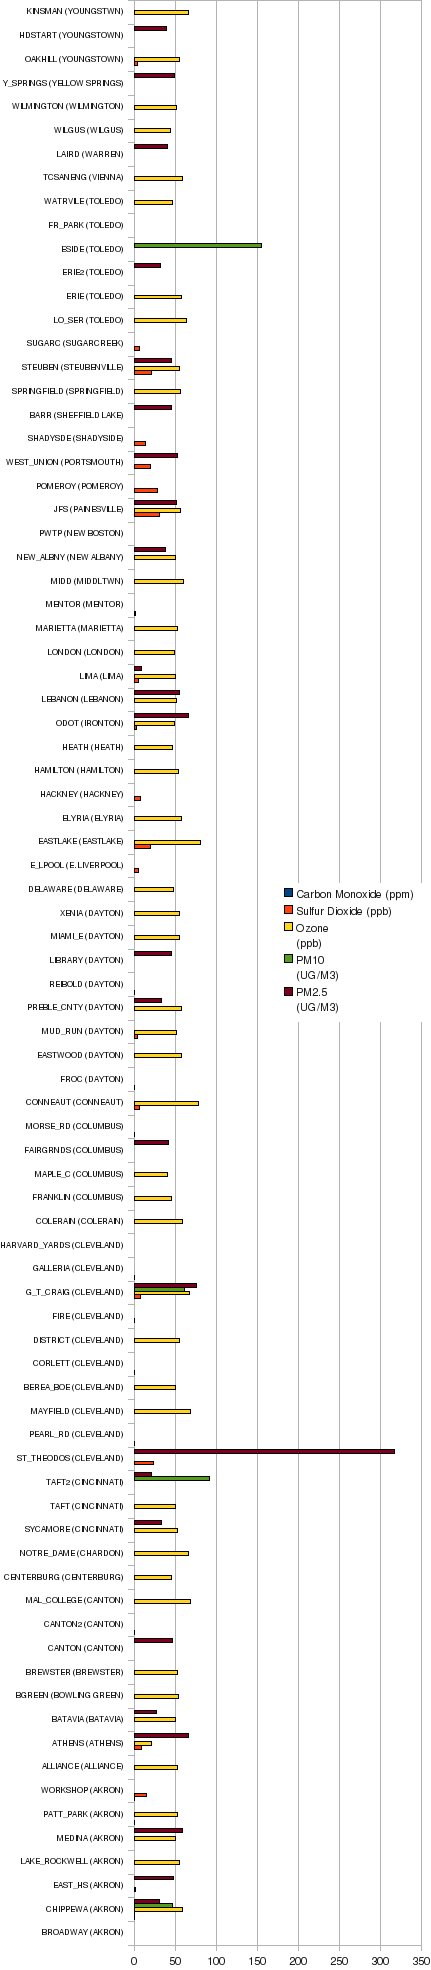
Some of the ambient air quality standards are:
- Carbon Monoxide:
- 1 hour = 35.0 ppm
- 8 hour = 9.0 ppm
- Sulfur Dioxide:
- 3 hour = 500 ppb
- 24 hour = 140 ppb
- Annual Arithmetic Mean = 30 ppb
- Ozone:
- 1 hour = 125 ppb
- 8 hour = 75 ppb
- Nitrogen Oxides: no standard
- Nitrogen Dioxide: Annual Arithmetic Mean = 50 ppb
- PM10:
- Annual Arithmetic Mean -- 50 ug per cubic meter Primary and Secondary.
- 24 hour concentration -- 150 ug per cubic meter Primary and Secondary.
- PM2.5:
- Annual Arithmetic Mean -- 15 ug per cubic meter Primary and Secondary.
- 24 hour concentration -- 65 ug per cubic meter Primary and Secondary.
- Lead: Quarterly Average = 1.5 ug per cubic meter Primary and Secondary.